We work with a lot of local businesses. Most of them do not track the online behavior of their online customers. There is a lot of data out there and one of the issues is knowing how to acquire, view and analyze that data. In the marketing world, you will see people refer to these reports as KPI’s (Key Performance Indicators). Our goal is put these KPI's in a visual format that is accessible and makes it easy to understand. This allows us to make better decisions. With great decisions comes growth, revenue and all the good stuff.
It’s not always easy. Especially for many local businesses that don’t have data analysts or full time marketing staff. Therefore, many businesses just shrug it off. You don’t have to. And I will show you how.
I’ll explain some of the basics of local business marketing analytics. How to acquire online data and how its used to measure results. Then I’ll show you examples of easy reports you can use it to grow your business.
Retail businesses or companies that also have online shops add another level of complexity. For now, I’m going to stick to service business that generates leads on the website via phone calls, contact forms and email links. And I’m going to focus on two primary sources of online business. Google Analytics (website) and Google My Business.
Data Acquisition #1 - Website - Google Analytics
The first place to acquire data about customers is through your website. These days almost every website uses Google Analytics (GA) as their primary tracking tool. There are other analytic tools, but if you have GA installed on your website, then you get access to enormous amounts of useful data. I recommend GA to everyone. Its free. Almost every CMS (like WordPress) has GA integration. It can also be integrated with hundreds of data analytics platforms and reporting tools.
With so many metrics in GA, its easy to get paralyzed by options. It can be difficult to navigate. Users often get frustrated trying to find useful information. I do this for a living and often dig through the help guides.
If you are lookign for better reports for website data, then what type of data do you need? To keep things simple, I’ll break down the most important data for a typical service business.
- Users - GA has sessions and new users. They have some merit and use. However, My clients want to know how many individual people have visited their website
- Pages - You need to know what pages users visit.
- Landing Pages - You want to know which page they started on
- Source - Where did they come from? Google? Facebook? Direct? Ads?
- Medium - This can be useful if you want to sort by all organic search (Google, Bing, Yahoo) or all Social (Facebook, Instagram, Linkedin, etc.)
- Goals - This is the most important piece of data and requires individual site configuration.
Google Analytics Goals
If I provide a service, then the goal is for people to read my website and contact my business. So on this website, I want goals for every type of contact. Forms, phone calls and email links.
You will get more advanced if you have multiple forms. You will also want to clearly label your forms in the GA goals section because each type of contact can serve a different purpose. As an example, the following types of forms are common on local business websites.
- Simple contact
- Request a quote
- Job inquiry or application
- Book and schedule a service
- book a calendar consultation
- Request information about a specific service
- Maintenance request forms
- Sign up for newsletters
As you can see, not all contacts are leads or new potential customers.
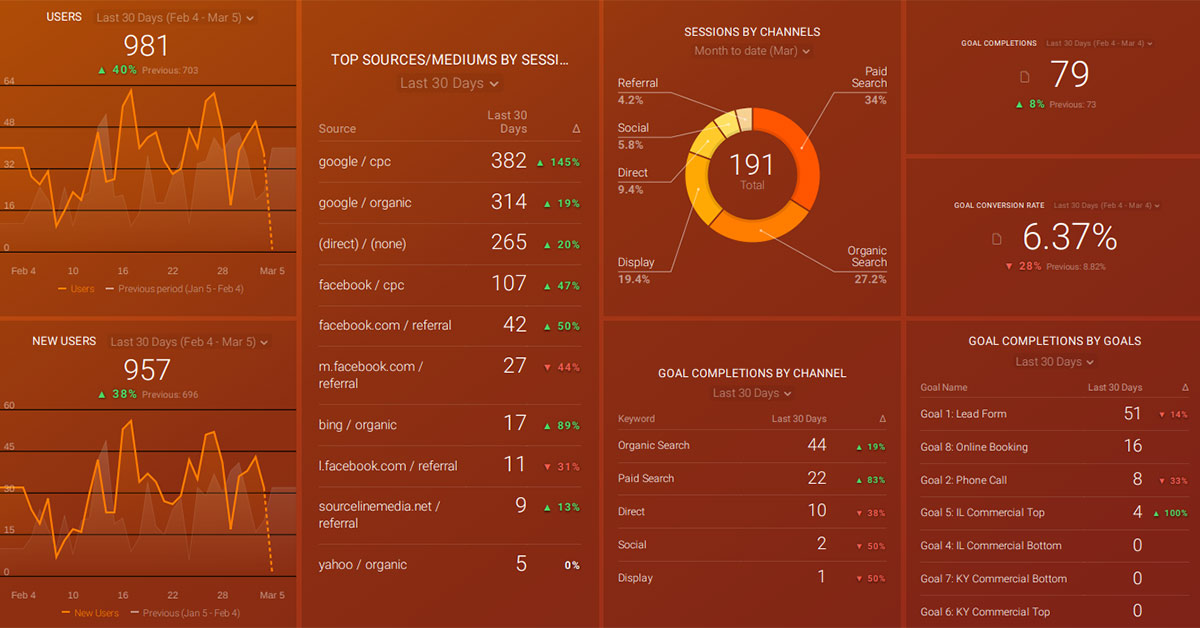
Below is a simple GA report thats a better report for website traffic as it measures source of traffic. The columns include users, each type of lead goal and the conversion rate. This gives me some data I want to track. Where they came from, how many, which type of lead. In this version I actually have phone calls separated so I know if they came from the home page or a secondary sub page.

Compare data over any period and you can learn a lot about your traffic, customers and conversions. Are you getting more traffic from a certain source? If so, then why? Did you change the text on a page? Did you add a video post in Google? Did we adjust the form or move the phone call button to the top of the page? If you make changes to a website you can then measure results.
In some cases, we run a lot more complex data. One of our clients is a property management firm. This business has multiple goal types. Some of these are not leads. For example, one of their goals is a property application which is used as a KPI to measure a different type of outcome. Many of these forms are filled out by existing customers.

We have to consider all this information, which requires some extra calculations to our data that will be critical for analysis.
The data helps us measure results. After adding new property pages this year, it will be helpful to view conversion and conversion rates from year to year. Armed with that knowledge, we can form effective strategies for the next leasing season.
Data Acquisition #2 - Website - Google My Business
For about 80% of our clients, Google My Business (GMB) has become a larger source of leads than their website. This wasn’t the case 5 years ago. And for an optimized profile, GMB can produce 5x more leads than a well optimized website.
Google started the GMB program in 2014 and it took a few years to really catch on. Now it has become a staple source for customers to learn about local businesses. Your GMB profile contains everything a customer needs to know about your business.
- products and services
- company history
- phone number
- service area
- location on a map
- ratings from customers
- review from customers
- your response to customers
- social posts within GMB
- Facebook page posts
This is plenty of information for a customer to make a decision and hit the call button, ask for directions or send a message. Some will find your website, but if you have a great profile, you will get a lot of new customers directly from GMB. This data needs to be measured and tracked (by the way, we are experts at GMB optimization as our #1 goal as a marketing agency is helping local businesses get more customers and grow revenue).
Retrieving that data from Google and placing it into easy-to-read reports is critical. I would even say its mandatory and a shame when businesses don’t know how many customers they get from GMB. The platform has a backend that allows you to login and look at basic data. However, the data displayed is inadequate You can only view a few basic metrics and only the last month or quarter of information.
We need a history of data over long and short periods to display and compare key metrics, such as:
- Searches
- Keywords
- Map displays
- Actions
- Phone calls
- Messages
- Website visits
Luckily Google has an API that allows us to access this data.
Next, I will explain how to access this data.
Databox - Build Better Reports for Website Traffic
I have personally developed hundreds of websites over the past 20 years. This involves integrating over 500 software platforms, tools and plugins within websites. I've also helped my clients test, demo and implement business class software for operational management, customer relationship management, customer support, accounting and sales.
In all those years, I have never been more impressed with another software application than I am with Databox. This platform allows you to pull in data from 1000+ sources and build custom reports. And in our example, it will allow me to build simple but incredibly powerful reports (called databoards). Here are a few amazing features:
- Databox reports are interactive. They load live data.
- Select date ranges in each table inside each report.
- Choose multiple sources to pull in data into a table.
- Publish reports as live, PDF or JPG.
- Set up reports to be delivered via email every day, week or month.
- Create goals to help you monitor and improve results.
- The mobile app includes all reports and its just awesome. (Pull that out in a meeting and you will blow people away).
Below is an example of a live report.
How To Build These Local Business Analytics Reports
The first step is to get a databox account. However, I want to offer my help here because I set these up all of our clients. It can be tricky. If you run a local businesses I get in touch as ask for Rob. Our cost is similar to basic Databox access but we provide more features, access to premade templates and add and we can do all the set up work. For more information, go to follow this link.
If you are someone likes to do it yourself, then you will need to set this up on Databox. They have a free trial so you can get a feel for it and make sure you can build key reports before you pay for the service.
You will need gather the following:
- Access to Google Analytics (Edit, Read and Collaborate)
- Access to Google My Business as an Owner or Manager
- Access to Google Search Console
- Access to your search engine tracking report Moz, SEMRush, Accuranker
Once you sign up, you will gain access to a lot of detailed tutorials, but the basic steps:
- Fill out your profile information
- Connect Data Sources
- Go to Databoards section and create a report
- Go through the metrics and determine which ones you need to make key decisions.
- In each data table I like to set all periods to last 30 days and use the same options such as Last 7, 14, 30, 90 days.
- Schedule delivery of those reports via email
- Set up goals and scorecards and schedule those reports.
That should get you started building better reports for website traffic. There is a lot you can do with Databox including calculated metrics. Some platforms that don't have API's will often provide a link to a CSV file that can be loaded into Google Sheets and allow you to build customized reports. This is getting into advanced report building, but gives you an idea of the endless possibilities.
I hope you found this article helpful. And if you get started on Databox and decide you don't have time or you just have questions, please reach out to me. You can schedule a time to chat on my calendar. I'll help you get these awesome reports set up and I can help you grow your business in other ways.
Best Regards,
Rob Thomas, Co-Founder of Sourceline Media